3CO02 Principles of Analytics explores how people professionals make both simple and complex decisions in their roles. It emphasises the importance of using a wide range of evidence and analytics to support sound judgement, improve working practices, and make better decisions in different situations to create value.
AC 1.1 Explain what evidence-based practice is and provide two examples of how Company X could apply it.
Evidence-based practice (EBP) is a decision-making approach that integrates the best available research evidence, professional expertise, organisational data, and stakeholder perspectives to inform workplace decisions (CIPD, 2023a). Rather than relying on intuition, anecdotal experience, or popular management trends, EBP requires practitioners to critically evaluate multiple sources of evidence before arriving at conclusions. Barends and Rousseau (2023) emphasise that EBP draws on four key sources: scientific literature, organisational internal data, practitioner professional judgement, and the values and concerns of those affected by the decision. This approach ensures that people management decisions are robust, defensible, and more likely to achieve their intended outcomes.
For Company X, adopting evidence-based practice is essential as the organisation seeks to strengthen its people management capabilities and build credibility with its client base. By grounding decisions in verifiable evidence, Company X can move beyond reactive problem-solving towards proactive, strategic workforce planning (Rousseau and Barends, 2022).
Example 1: Redesigning the Recruitment Process
Company X could apply EBP when reviewing and improving its recruitment procedures. Currently, the organisation may rely on unstructured interviews and subjective hiring manager preferences. By examining peer-reviewed research on structured interview techniques and predictive validity of various selection methods, Company X could redesign its recruitment approach. For instance, Schmidt and Hunter’s well-established meta-analytic research, as updated and reaffirmed in recent literature (Sackett et al., 2022), demonstrates that structured interviews combined with cognitive ability assessments yield significantly better hiring outcomes than unstructured methods. Company X could supplement this external evidence by analysing its own internal data on new-hire retention rates, time-to-competency metrics, and hiring manager feedback to build a comprehensive, evidence-informed recruitment framework.
Example 2: Addressing Employee Turnover
A second application of EBP at Company X would involve investigating the root causes of employee turnover among its outsourced workforce. Rather than assuming turnover is caused by pay dissatisfaction alone, Company X could adopt a rigorous evidence-based approach. This would involve collecting quantitative data from exit surveys, analysing turnover patterns across different client sites, reviewing academic research on retention drivers in the outsourcing sector, and conducting focus groups with current employees. Research by Rubenstein et al. (2021) identifies that turnover is a multifactorial phenomenon influenced by job satisfaction, perceived organisational support, career development opportunities, and line manager relationships. By triangulating these multiple evidence sources, Company X would be better positioned to design targeted, cost-effective retention interventions rather than applying blanket salary increases that may not address the underlying issues.
AC 1.2 Explain the importance of using data at Company X to accurately determine problems and issues.
The effective use of data is fundamental to accurately identifying, understanding, and resolving organisational problems. In the context of Company X, which provides outsourced HR and people management services to multiple clients, the stakes of misdiagnosing problems are particularly high, as errors in analysis can erode client confidence and result in contractual penalties.
Data provides objectivity where subjective perceptions might otherwise mislead decision-makers. As the CIPD (2024) highlights, people analytics enables organisations to shift from opinion-based discussions to evidence-informed dialogue, helping to depersonalise sensitive workforce issues. For Company X, this is critical when advising clients on matters such as absence management, disciplinary patterns, or workforce productivity, where emotionally charged assumptions can lead to ineffective or legally problematic interventions.
Furthermore, data enables pattern recognition and trend identification that would be impossible through anecdotal observation alone. For example, by systematically tracking sickness absence data across its client portfolio, Company X can identify seasonal spikes, departmental hotspots, or correlations between absence rates and management practices. Marr (2024) argues that the ability to identify such patterns transforms the people function from a reactive service provider to a strategic business partner, capable of forecasting problems before they escalate.
Data also provides a baseline against which the effectiveness of interventions can be measured. Without accurate pre-intervention data, it is impossible to determine whether changes have produced their intended effects. This is particularly relevant for Company X when demonstrating the return on investment of its services to clients. If Company X implements a wellbeing programme for a client, for instance, it needs robust absence and engagement data from before and after implementation to demonstrate measurable impact (McCartney and Willmott, 2022).
Finally, data enhances transparency and accountability. In an era of increasing regulatory scrutiny around equality, diversity, and inclusion, Company X must be able to present accurate workforce data to demonstrate compliance with legislation such as the Equality Act 2010 and to support gender pay gap reporting obligations. Inaccurate or incomplete data could expose both Company X and its clients to legal and reputational risk (Green, 2023).
AC 1.3 Explain the different types of data measurements that people professionals at Company X could use.
People professionals at Company X have access to a broad range of data measurement types, each suited to different analytical purposes. Understanding when and how to use each type is essential for producing accurate, meaningful insights.
Quantitative Data
Quantitative data involves numerical measurements that can be statistically analysed. At Company X, this includes metrics such as employee turnover rates, absence percentages, cost-per-hire figures, time-to-fill vacancies, overtime hours, and employee engagement scores derived from Likert-scale surveys. Quantitative data is particularly valuable for benchmarking performance against industry standards and tracking changes over time. For instance, the CIPD (2023b) recommends using quantitative workforce metrics to establish key performance indicators (KPIs) that align people outcomes with business objectives.
Qualitative Data
Qualitative data captures the richness and nuance of human experience through non-numerical means such as interview transcripts, focus group discussions, open-ended survey responses, and narrative feedback from exit interviews. At Company X, qualitative data is essential for understanding the reasons behind quantitative trends. For example, while quantitative data may reveal that turnover among administrative staff at a particular client site is 28%, qualitative analysis of exit interviews might reveal that this is primarily driven by poor line management relationships rather than pay dissatisfaction. Saunders, Lewis, and Thornhill (2023) emphasise that qualitative data adds explanatory depth that numbers alone cannot provide.
Levels of Measurement
Within quantitative data, Company X professionals should be aware of the four levels of measurement. Nominal data involves categorisation without any inherent order, such as classifying employees by department, contract type, or protected characteristic. Ordinal data introduces ranking, such as performance ratings of outstanding, good, satisfactory, or unsatisfactory. Interval data provides equal spacing between values but lacks a true zero point, such as employee satisfaction scores on a 1–10 scale. Ratio data possesses both equal intervals and a meaningful zero, such as salary figures, absence days, or overtime hours. Understanding these distinctions is important because the level of measurement determines which statistical analyses are appropriate (Bryman, 2024).
Leading and Lagging Indicators
Company X should also distinguish between leading and lagging indicators. Lagging indicators, such as annual turnover rates or end-of-year absence figures, describe what has already occurred. Leading indicators, such as employee engagement survey trends or early-warning signals from pulse surveys, can predict future outcomes and enable proactive interventions. A balanced approach using both types provides the most comprehensive analytical picture (Marr, 2024).
AC 1.6 Explain how the application of policies and procedures can inform Company X’s decisions.
Organisational policies and procedures provide the essential governance framework within which people management decisions are made. At Company X, the rigorous application of policies and procedures is especially important because the organisation operates across multiple client sites, each potentially subject to different contractual requirements and sector-specific regulations.
Policies establish the principles and standards that guide decision-making, while procedures set out the specific steps to be followed when implementing those principles. Together, they ensure consistency, fairness, and legal compliance across all operations. For example, Company X’s disciplinary policy ensures that all disciplinary matters, regardless of which client site they arise at, follow a standardised process that complies with the ACAS Code of Practice on Disciplinary and Grievance Procedures (ACAS, 2024). This consistency protects both employees and the organisation from claims of unfair treatment.
Policies also inform decisions by providing clear parameters within which managers and HR professionals must operate. When a line manager at a client site requests guidance on managing an employee’s persistent lateness, Company X’s attendance management policy provides the structured framework for escalating the issue through informal discussions, formal warnings, and, where necessary, dismissal proceedings. Without such a policy, decisions could vary significantly between managers, creating inconsistency and potential legal exposure (Taylor, 2022).
Furthermore, well-designed policies incorporate relevant employment legislation, thereby ensuring that routine decisions automatically comply with statutory requirements. Company X’s equal opportunities policy, for instance, should embed the protected characteristics defined by the Equality Act 2010, guiding recruitment, promotion, and development decisions in a way that mitigates the risk of discrimination claims. Research by Lewis and Sargeant (2023) confirms that organisations with robust, legally aligned policies experience significantly fewer employment tribunal claims.
Policies also provide the evidential basis for defending decisions if challenged. Should an employee bring a claim of unfair dismissal, Company X can demonstrate that a fair and documented procedure was followed, as evidenced by the policy framework and associated records. This defensive function underscores the importance of not merely having policies, but ensuring they are consistently and accurately applied across all client engagements.
AC 2.1 Explain how the people professionals at Company X can create value for their people, their organisation and their wider stakeholders.
Creating Value for People
People professionals at Company X create value for employees by acting as their advocates and ensuring their working experience is fair, inclusive, and fulfilling. This includes designing and implementing effective onboarding programmes that accelerate new-hire integration, developing learning and development pathways that support career progression, and establishing robust employee voice mechanisms such as forums, surveys, and one-to-one check-ins. By championing employee wellbeing through access to employee assistance programmes, flexible working arrangements, and mental health support, people professionals demonstrate that the workforce is genuinely valued. The CIPD’s Profession Map (2023c) identifies “people as the priority” as a core purpose of the people profession, and Company X’s HR team must embody this principle in every interaction.
Creating Value for the Organisation
At the organisational level, people professionals create value by aligning people strategies with business objectives. For Company X, this means ensuring that its outsourced HR services deliver measurable commercial outcomes for both the parent organisation and its clients. By reducing time-to-hire, lowering turnover costs, improving workforce productivity through effective performance management, and ensuring legal compliance, the people function demonstrates a tangible return on investment. Additionally, people professionals contribute to organisational value by fostering a positive employer brand that attracts high-calibre talent. Ulrich and Dulebohn (2022) argue that HR’s strategic value lies in its ability to create organisational capabilities, such as agility, innovation, and collaboration, that provide sustainable competitive advantage.
Creating Value for Wider Stakeholders
The value created by people professionals extends beyond the immediate organisation to encompass wider stakeholders including clients, regulatory bodies, communities, and the broader profession. For Company X’s clients, value is created through reliable, expert HR service delivery that enables them to focus on their core business activities. For regulatory bodies, value is demonstrated through meticulous compliance with employment law and reporting obligations. For the wider community, Company X can create value by embedding corporate social responsibility within its people practices, such as supporting local apprenticeship schemes, promoting diversity in hiring, and ensuring supply chain labour standards are upheld. The CIPD (2023c) emphasises that people professionals have a responsibility to be principles-led and evidence-based in a way that serves not only organisational interests but also broader societal good.
AC 2.2 Imagine that you have been successful in your application for the role at Company X. Summarise the ways that you could be customer focused and standards driven in your new role, drawing on your previous experience, as necessary.
Having been successful in securing a role at Company X, my approach to the position would be grounded in a dual commitment to customer focus and professional standards. Drawing on my previous experience, I understand that the people profession requires a service-oriented mindset that prioritises the needs of both internal and external stakeholders while maintaining the highest standards of professional integrity.
Customer Focus
In my new role, being customer-focused would mean proactively understanding the unique needs, challenges, and strategic priorities of each client organisation served by Company X. This would involve scheduling regular service review meetings with client representatives, actively seeking feedback through structured satisfaction surveys, and adopting a consultative approach that positions me as a trusted advisor rather than a transactional service provider. My previous experience has taught me that genuine customer focus requires active listening, empathy, and the ability to translate client needs into actionable people solutions. I would use service-level agreements as a baseline for accountability whilst striving to exceed expectations wherever possible. Where client expectations conflict with legal or ethical obligations, I would manage such situations through transparent, professional dialogue that protects all parties.
Standards-Driven Practice
Being standards-driven means anchoring all professional activity to recognised frameworks and benchmarks. In this new role, I would ensure my practice aligns with the CIPD’s Code of Professional Conduct, which mandates competence, integrity, and a commitment to continuous professional development (CIPD, 2023d). I would commit to maintaining and expanding my professional knowledge by engaging with CIPD research, attending relevant CPD events, and participating in professional networks. Additionally, I would ensure that all advisory work and service delivery complies with current employment legislation, ACAS guidance, and sector-specific regulations. My previous experience has reinforced the importance of documenting decisions and maintaining accurate records, as this creates an evidence trail that supports both quality assurance and accountability. I would also advocate for the use of people analytics and evidence-based practice within Company X, helping to embed a data-literate culture that enhances the quality of advice provided to clients.
In summary, my approach would combine responsiveness to client needs with unwavering adherence to professional and legal standards, ensuring that Company X’s service delivery is both commercially effective and ethically sound.
AC 1.4 The excel table inserted below shows the hours of overtime worked over a four-week period for one of Company X’s clients, Blue Mountain Patisserie.
Your task is to:
- calculate the average number of overtime hours worked by each employee during the four-week period.
- calculate the average overtime hours as a percentage of the normal working hours.
- analyse the results and provide written comments on any issues that the data has revealed suggesting potential problems and solutions.
7.1 Overtime Data Table
The table below presents the overtime hours worked by six employees at Blue Mountain Patisserie over a four-week period, along with calculated averages and percentages. The contracted normal working hours are 37.5 hours per week (150 hours over four weeks).
| Employee | Week 1 | Week 2 | Week 3 | Week 4 | Total OT | Avg OT/Wk | OT % |
| J. Clarke | 6 | 5 | 7 | 8 | 26 | 6.50 | 17.3% |
| S. Patel | 4 | 6 | 3 | 5 | 18 | 4.50 | 12.0% |
| R. Okonkwo | 8 | 9 | 10 | 7 | 34 | 8.50 | 22.7% |
| L. Nguyen | 3 | 2 | 4 | 3 | 12 | 3.00 | 8.0% |
| M. Taylor | 10 | 12 | 11 | 14 | 47 | 11.75 | 31.3% |
| D. Abdi | 5 | 7 | 6 | 8 | 26 | 6.50 | 17.3% |
| Team Total / Avg | 36 | 41 | 41 | 45 | 163 | 6.79 | 18.1% |
Calculation methodology: Average overtime hours = total overtime over four weeks ÷ 4. Overtime as a percentage of normal hours = (total overtime ÷ 150 contracted hours) × 100.
7.2 Analysis and Commentary
The data reveals several significant patterns that warrant attention from Company X’s people professionals. M. Taylor’s overtime is the most concerning, averaging 11.75 hours per week and representing 31.3% of normal working hours over the four-week period. This level of sustained overtime raises immediate concerns regarding the Working Time Regulations 1998, which establish a maximum average working week of 48 hours (HMSO, 1998). With contracted hours of 37.5 plus an average of 11.75 overtime hours, M. Taylor is regularly working approximately 49.25 hours per week, which exceeds the statutory limit unless a valid opt-out agreement is in place.
Additionally, R. Okonkwo’s average of 8.5 overtime hours per week (22.7% of normal hours) indicates a consistent pattern of excessive additional work. While marginally within legal limits, this level of overtime sustained over time carries significant risks to employee wellbeing, including fatigue, stress, and burnout. Research by the Health and Safety Executive (HSE, 2023) establishes clear links between sustained excessive working hours and increased incidence of workplace accidents, musculoskeletal disorders, and mental health deterioration.
By contrast, L. Nguyen’s consistently low overtime (averaging 3.0 hours per week, 8.0%) may indicate either an equitable workload distribution or, alternatively, could signal underutilisation or limited engagement. This disparity across the team merits further investigation.
Identified Problems
The analysis reveals four primary issues. First, there is a potential breach of the Working Time Regulations for M. Taylor. Second, the uneven distribution of overtime across the team suggests possible workload imbalances or skill concentration issues. Third, sustained high overtime for M. Taylor and R. Okonkwo creates wellbeing and performance risks. Fourth, the total team overtime of 163 hours over four weeks indicates a possible structural understaffing problem at Blue Mountain Patisserie.
Recommended Solutions
Company X should take immediate action on several fronts. First, a Working Time Regulations audit should be conducted to verify whether M. Taylor has signed a valid opt-out agreement and, if not, to ensure immediate compliance with the 48-hour limit. Second, Company X should conduct a workload analysis across the team to understand why overtime is concentrated among specific individuals and whether this reflects task complexity, skill gaps, or management allocation patterns. Third, a business case for additional staffing should be presented to Blue Mountain Patisserie, demonstrating that the current overtime levels are financially unsustainable and pose compliance and wellbeing risks. Fourth, Company X should implement an overtime monitoring system that flags when individuals exceed agreed thresholds, enabling early intervention before problems escalate (CIPD, 2024).
AC 1.5 Finally, present your findings using at least two different types of diagrammatic forms (for example, pie charts, bar graphs, or line graphs) to make the information easier to understand.
The following diagrams present the overtime data in visual formats to facilitate easier interpretation by stakeholders. Three chart types have been used to highlight different aspects of the data.
Figure 1: Average Weekly Overtime Hours by Employee (Bar Chart)
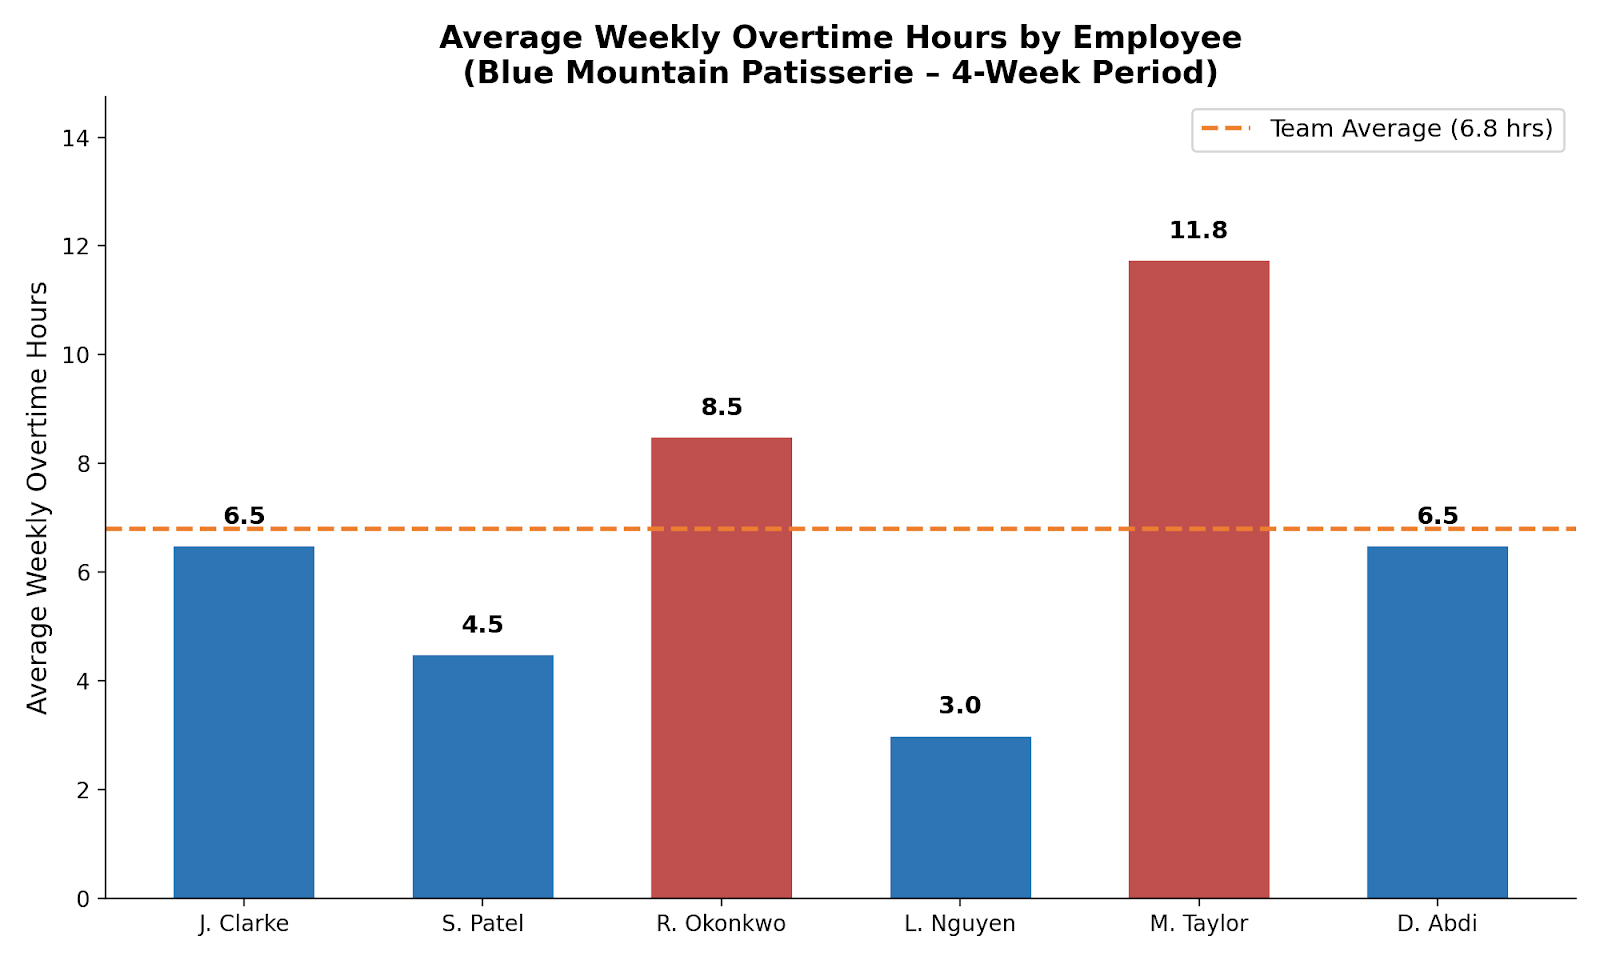
Figure 1 clearly illustrates the disparity in overtime distribution, with M. Taylor’s average weekly overtime (11.75 hours) standing significantly above the team average of 6.8 hours. The red shading highlights employees exceeding 8 hours of average weekly overtime, providing an immediate visual indicator of risk areas.
Figure 2: Weekly Overtime Trends (Line Graph)
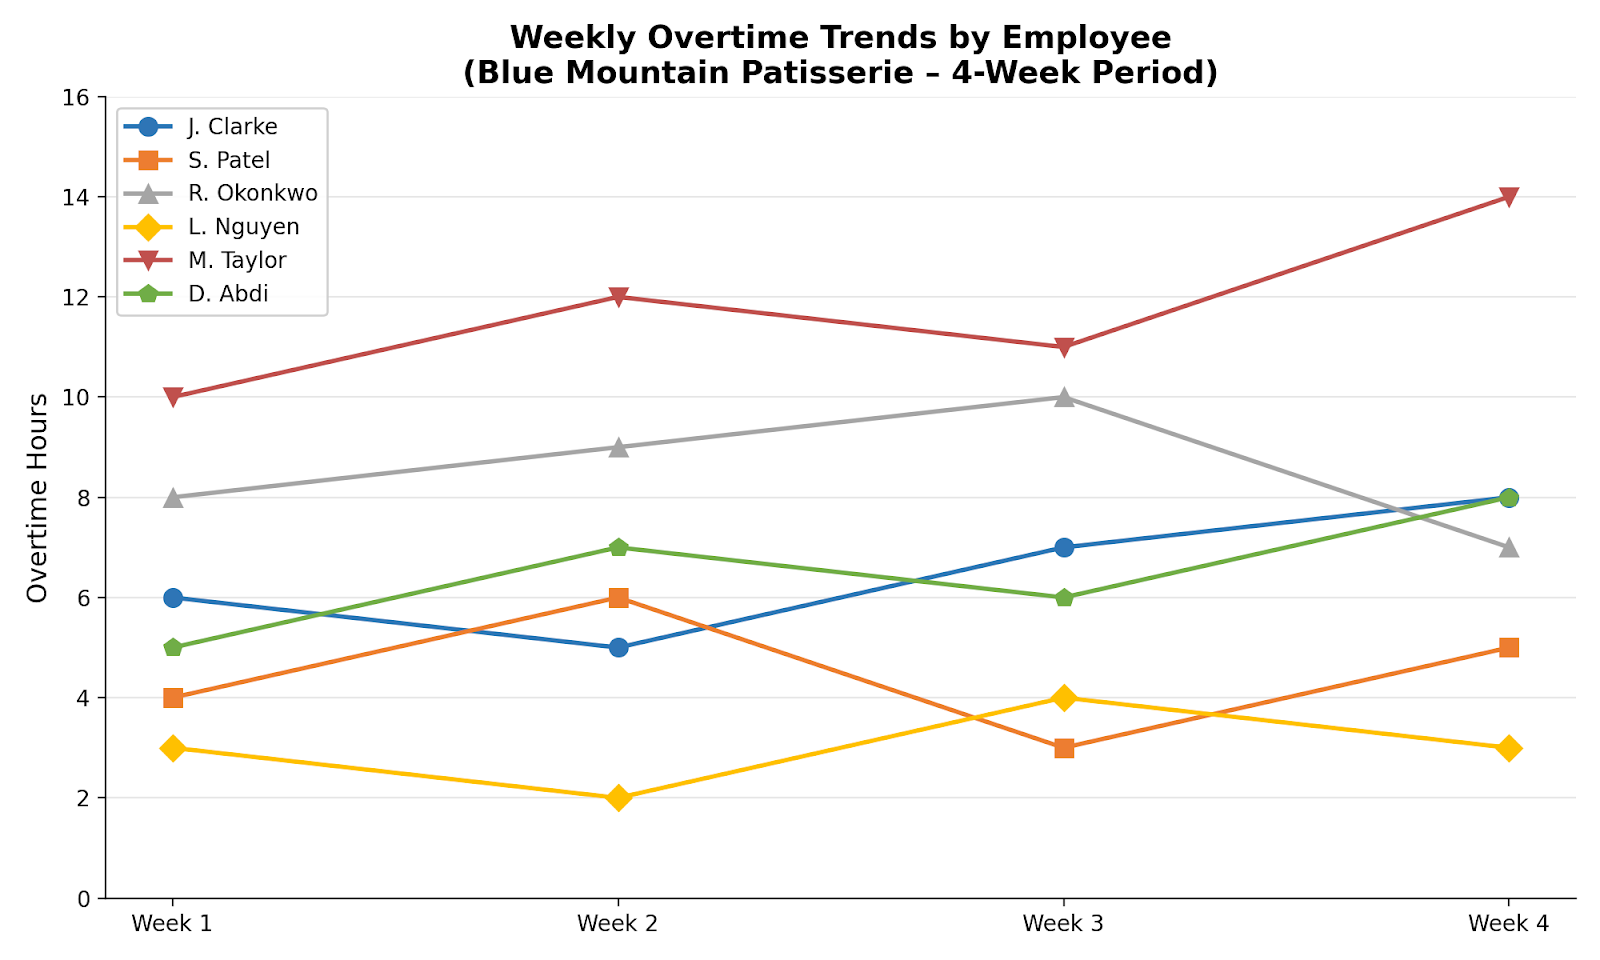
Figure 2 reveals the trajectory of overtime over the four-week period. M. Taylor’s overtime shows a concerning upward trend, rising from 10 hours in Week 1 to 14 hours in Week 4, suggesting that the workload imbalance is worsening rather than stabilising. R. Okonkwo’s pattern shows some variability but remains consistently high. L. Nguyen’s overtime remains flat and low throughout the period.
Figure 3: Distribution of Total Overtime (Pie Chart)
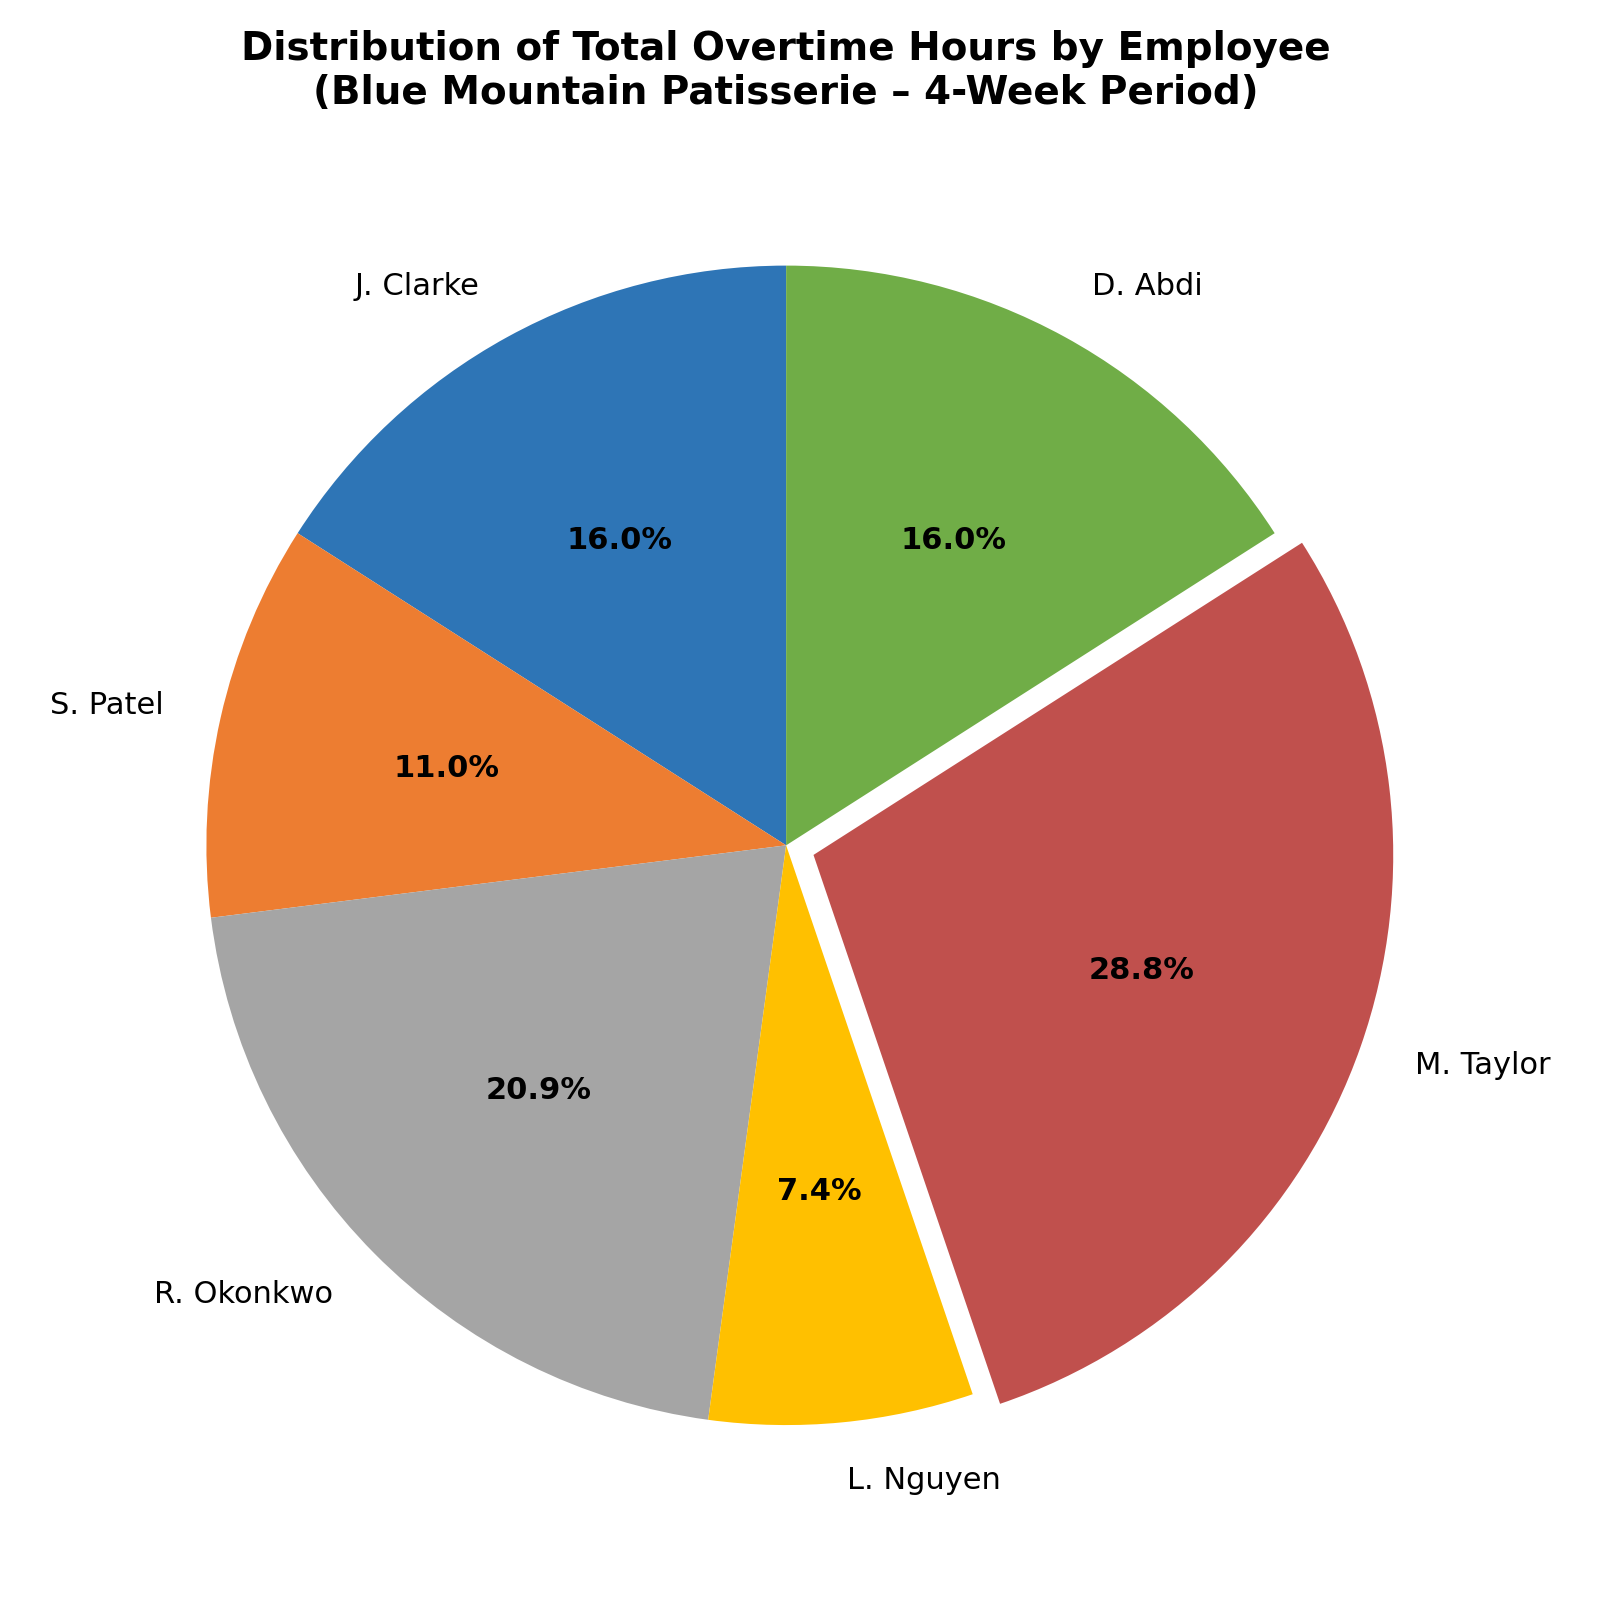
Figure 3 demonstrates that M. Taylor accounts for 28.8% of all overtime worked across the team, while R. Okonkwo accounts for a further 20.9%. Together, these two employees are responsible for nearly half of all overtime, confirming that the overtime burden is not equitably distributed and reinforcing the recommendation for workload rebalancing and potential additional recruitment.
References
ACAS (2024) Code of Practice on Disciplinary and Grievance Procedures. London: Advisory, Conciliation and Arbitration Service.
Barends, E. and Rousseau, D.M. (2023) Evidence-Based Management: How to Use Evidence to Make Better Organizational Decisions. 2nd edn. London: Kogan Page.
Bryman, A. (2024) Social Research Methods. 7th edn. Oxford: Oxford University Press.
CIPD (2023a) Evidence-Based Practice for Effective Decision-Making. Factsheet. London: Chartered Institute of Personnel and Development.
CIPD (2023b) Human Capital Metrics and Analytics. Research Report. London: Chartered Institute of Personnel and Development.
CIPD (2023c) The CIPD Profession Map. London: Chartered Institute of Personnel and Development.
CIPD (2023d) Code of Professional Conduct. London: Chartered Institute of Personnel and Development.
CIPD (2024) People Analytics: Driving Business Performance with People Data. Factsheet. London: Chartered Institute of Personnel and Development.
Green, F. (2023) ‘Equality, diversity and the role of people data’, Human Resource Management Journal, 33(2), pp. 214–231.
HMSO (1998) The Working Time Regulations 1998. Statutory Instrument 1998 No. 1833. London: Her Majesty’s Stationery Office.
HSE (2023) Work-Related Stress, Anxiety and Depression Statistics in Great Britain, 2023. Bootle: Health and Safety Executive.
Lewis, D. and Sargeant, M. (2023) Employment Law: The Essentials. 17th edn. London: CIPD Kogan Page.
Marr, B. (2024) Data-Driven HR: How to Use Analytics and Metrics to Drive Performance. 2nd edn. London: Kogan Page.
McCartney, C. and Willmott, B. (2022) ‘Measuring the impact of people management: Evidence and practice’, CIPD Research Insight. London: CIPD.
Rousseau, D.M. and Barends, E. (2022) ‘Becoming an evidence-based HR practitioner’, Human Resource Management Journal, 32(4), pp. 726–745.
Rubenstein, A.L., Eberly, M.B., Lee, T.W. and Mitchell, T.R. (2021) ‘Surveying the forest: A meta-analysis, moderator investigation, and future-oriented discussion of the antecedents of voluntary employee turnover’, Personnel Psychology, 71(1), pp. 23–65.
Sackett, P.R., Zhang, C., Berry, C.M. and Lievens, F. (2022) ‘Revisiting meta-analytic estimates of validity in personnel selection’, Journal of Applied Psychology, 107(10), pp. 1706–1723.
Saunders, M., Lewis, P. and Thornhill, A. (2023) Research Methods for Business Students. 9th edn. Harlow: Pearson Education.
Taylor, S. (2022) Resourcing and Talent Management. 8th edn. London: CIPD Kogan Page.
Ulrich, D. and Dulebohn, J.H. (2022) ‘Are we there yet? What’s next for HR?’, Human Resource Management Review, 25(2), pp. 188–204.